


(PICTORIAL MAPS -- DATA VIZ.) Roy Wenzlick & Co. A
Similar Sale History
View More Items in Maps & Atlases


Related Maps & Atlases


![Rand, McNally & Co.'S New Commercial Railroad Map of the United States [Chicago to Denver]: Title: Rand, McNally & Co.'S New Commercial Railroad Map of the United States [Chicago to Denver] Cartographer: RAND, MCNALLY & CO. Publisher: RAND-MCNALLY & CO. Dimensions: Height: 26 Width: 18.5 Des](https://p1.liveauctioneers.com/5584/329422/177662153_1_x.jpg?height=310&quality=70&version=1715717898)


![Large Map of Alaska: Large Map of Alaska With map of Washington and Oregon [separately] on versos Cartographer: George Franklin Cram Dated: Circa 1900 Type: Color Lithograph Dimensions: 14](https://p1.liveauctioneers.com/5614/330257/178045317_1_x.jpg?height=310&quality=70&version=1716032806)

![Large Map of Texas (Western Part): Large Map of Texas (Western Part) With map of Louisiana and Arkansas [separately] on versos Cartographer: George Franklin Cram Dated: Circa 1900 Type: Color Lithograph Dime](https://p1.liveauctioneers.com/5614/330257/178045313_1_x.jpg?height=310&quality=70&version=1716032806)
![Large Map of Hawaiian Islands & Porto Rico: Large Map of Porto Rico With map of Hawaii - Hawaiian Islands and Samoa [separately] on versos] Cartographer: George Franklin Cram Dated: Circa 1900 Type: Color Lithograph](https://p1.liveauctioneers.com/5614/330257/178045318_1_x.jpg?height=310&quality=70&version=1716032806)
![Large Map of Montana: Large Map of Montana With map of Utah and Wyoming [separately] on versos Cartographer: George Franklin Cram Dated: Circa 1900 Type: Color Lithograph Dimensions: 14 1/2](https://p1.liveauctioneers.com/5614/330257/178045315_1_x.jpg?height=310&quality=70&version=1716032806)
More Items in Maps & Atlases
View More

![[MAP]. TODESCHI, Pietro. [Nova et Acurata Totius Americae Tabula auct. G.I. Blaeu] America quarta: [MAP]. TODESCHI, Pietro. [Nova et Acurata Totius Americae Tabula auct. G.I. Blaeu] America quarta pars orbis quam plerunq, nuvum orbem appellitant primo detecta est anno 1492 a Christophoro Columbo...](https://p1.liveauctioneers.com/197/329395/177650542_1_x.jpg?height=310&quality=70&version=1715364962)


![[MAPS]. HOMANN, Johann Baptist, HOMANN HEIRS, and Georg Matthäus SEUTTER. [Composite Atlas].: [MAPS]. HOMANN, Johann Baptist (1663-1724), HOMANN HEIRS, and Georg Matthäus SEUTTER (1678-1757). [Composite Atlas]. [Nuremberg, Augsburg, and others: Homann Heirs and others, maps dated between](https://p1.liveauctioneers.com/197/329395/177650530_1_x.jpg?height=310&quality=70&version=1715364962)


Recommended Transportation & Travel Collectibles
View More


Item Details
Description
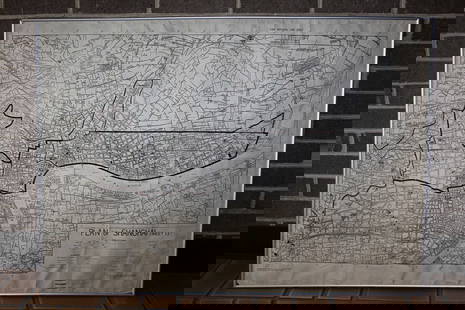
(PICTORIAL MAPS -- DATA VIZ.) Roy Wenzlick & Co. A Century of Real Estate Trends. [and] Basic Barometers of Real Estate Trends. Together two large-scale offset color printed broadside charts presenting data-driven maps and diagrams relating to mid-20th century United States real estate and housing statistics. 24x39¼ inches each sheet size; occasional soft creasing though no major flaws; original shipping tube with Wenzlick & Co. label addressed to a San Francisco capital investor. St. Louis, 1951; 1952
Two outstanding visual charts compiled by Roy Wenzlick, a prominent 20th-century real estate economist group.
"A Century of Real Estate Trends" - the central map illustrates Percentage Change in the Number of Dwelling Units by Counties: 1940 to 1950; the panels at top and bottom chart Real Estate Activity and Business Activity from 1850 to 1950; a series of graphs at left center shows the Construction Cost of Six Standard Buildings (California bungalow, five-room brick house, six-room frame house, six-room brick house, 18-family brick apartment building, and a 30-unit concrete apartment building); at right center are shown Factors Affecting Real Estate Sales and Values from 1900 to 1950 (such as building material costs, mortgage activity, residential interest rates, etc.); Corporate Earnings, Dividends and Taxes from 1940 to 1950; Trend in Farm Values from 1910 to 1950; and Shrinkage in the Purchasing Power of the Dollar from 1939 to 1950 (represented by stacks of pennies and value decreased by almost half in the short timeframe).
"Basic Barometers of Real Estate Trends" - main map presents Percentage of Change in Total Population by Counties: 1940 to 1950; the upper panel delineates Real Estate and Business Activity from 1850 to 1950; below that is Shrinkage in the Purchasing Power of the Dollar from 1900 to 1950 (with an even more depressing decrease than the earlier pattern); at left are seen Construction Costs Continue to Climb; Factors Affecting New Building; Taxes, Savings and Expenditures; Farm Value, Taxes and Income; at lower right are six graphs showing Regional Patterns of Real Estate Activity from 1890 to 1950 (New England, East Central, West Central, South, South, Southwest and West Coast) with notations pointing out the model of an 18-year cycle of booms and depressions to the market.
OCLC locates no more than three examples of each sheet, with the Milwaukee County Public Library listed as the only institution owning both.
Buyer's Premium
- 30%
(PICTORIAL MAPS -- DATA VIZ.) Roy Wenzlick & Co. A
Estimate $400 - $600
5 bidders are watching this item.
Shipping & Pickup Options
Item located in New York, NY, usOffers In-House Shipping
Local Pickup Available
Payment

Auction Curated By

Specialist, Maps & Atlases
Related Searches
TOP